

I like dashboards. They give tons of critical information at a glance. I wouldn’t drive my car without a dashboard. I wouldn’t want to drive a hockey team without a dashboard!
I put this chart together adapting the format from @datarink’s league Corsi and PDO dashboard.
Take a look and then we’ll do some analysis on the other side:
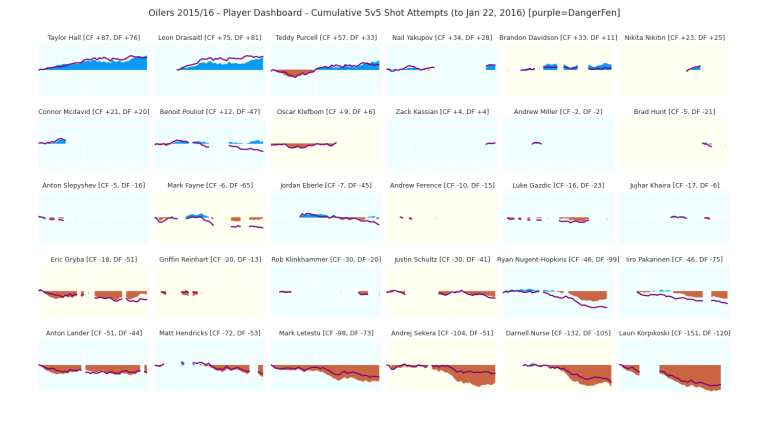 Just a quick legend for this chart:
- Each little player block shows the cumulative shot attempts for vs against for every player. If the total is zero or above, it shows as blue. Underwater and it shows as um, I think that’s ‘burnt sienna’. So this shows you not only where the player is, but how they got there over the course of the season.
- The purple line is my own Dangerous Fenwick metric, which weights shot attempts by shot type and distance. You can think of it as a blend of shot attempts and High Danger Scoring Chances.
- Blocks with a pale yellow background are defensemen, and pale blue is for forwards.
- The whole thing is sorted from best to worst.
First, if I do say so myself!, I’m quite surprised at how much information is exposed just by seeing the whole team laid out like this. What do you think?
Any way, I thought I’d give you some thoughts about what I’m reading (or perhaps confirming) from looking at the chart:
- Taylor Freakin’ Hall. Trade the bum
- Neon Leon. Wow. No surprise, but wow.
- You can really see the turnaround in Teddy Purcell’s game. A lot of that is playing with Hall and Draisaitl – but IMO he hasn’t been a passenger.
- If you didn’t already know, we will miss Brandon Davidson more than you might think for a guy playing his first full NHL season.
- Yak City has been terrific, with or without Connor McDavid. Matt Henderson has a nice article out this morning on the improvement in Yak’s numbers this season.
- Nikita Nikitin remains a fancystat mystery.
- ONE MORE GAME TO CONNOR MCDAVID! THE PRECIOUS RETURNS! [after the All Star break]
- Pouliot’s Dangerous Fenwick trails his possession numbers by a fairly wide margin. This usually indicates some combination of a player (or his line, rather) being susceptible to perimeter play and/or bad defensive breakdowns. Not a good place for a designated veteran power forward to be.
- Oscar Klefbom had an uneven start to the season, but was just hitting his stride when he got hurt. Because Oilers.
- Mark Fayne has decent possession numbers but his DangerFen trails those numbers by a fairly wide margin. I wrote about this before – he’s good at playing a conservative defensive game, but when he gets beat, he doesn’t have the footspeed to recover, so he really gets beat. You can really see the DangerFen fall off, just around the time he was being benched and then sent down. He’s been better since he returned – and lordy, do we need him to be.
- Jordan Eberle’s numbers also show a decent possession forward, but his DangerFen indicates susceptibility to perimeter play and/or bad defensive breakdowns. Probably a fair summation of his season so far?
- Eric Gryba – not so good at the hockey, but he’s really been improving as of late (see the upward slope in his graph the last little bit). Maybe an OK bet to stick around as 6/7 D, but it’s a problem if he has to play higher than that in the lineup.
- Justin Schultz’s numbers are as they often are – he creates some, but gives up more. Did OK with Klefbom last year – that’s probably the only guy with both the speed and the defensive awareness to cover for Mr. Chaos.
- Oy vey, poor broken Nugey. You can really see how his game went completely off the rails after he missed a few games due to illness. I’m thinking there’s more to it – either the illness is more long standing, like mono, or there’s an injury that he was playing through that we weren’t told about. Either way, I hope this stretch recovering from hand surgery lets him also recover from whatever else is bothering him. Because something clearly is.
- Andrej Sekera is the lone top pairing D on this team. He is not a 1D though, and it shows. The one saving grace is that his DangerFen is better than his possession metrics, suggesting he’s often effective at shutting down dangerous plays. He needs help.
- Hendricks’ possession numbers are OK at best given his role, but his warrior and ‘balls of steel’ numbers are off the chart!
- Nurse is being crushed. He held his own for the first handful of games, and then it went off the rails. This is NOT a good sign for his development. He needs to be third pairing with good veteran help (i.e. NOT Justin Schultz or Eric Gryba), or he needs to be in the AHL for a while. No shame in that – learning defense is the hardest part of the game at the NHL level.
- Perhaps the wise move would be to have Korpikoski out there for the PK and nothing else.
Agree, disagree? Anything else you’d care to add?

I really like this chart! It’s informative to see a players progress over the season and to match the chart with what your observations are. Thanks!
LikeLike
No problem, thanks for reading!
LikeLike
Kudos
LikeLike
Mercy buckets!
LikeLike
Excellent dashboard. Would like to CF/60 and DF/60 as well. (And if you ever do a site where the charts can be resorted sorts by CF DF CF/60 and DD/60).
Would be beyond cool if you ever set up links in the dashboard to your posts. Click on Nuge chart and see your most recent analysis of Nuge and all articles tagged to Nuge. (And if you ever do a pan NHL site to all contributions on OEL or whoever).
Yeah. The usual reward for great work.
LikeLike
Thanks! Yeah, I’m looking into how I can make the data more easily available. But the potential work is a bit on the scary side!
LikeLike